

The next step in assessing a field with the P Index is to determine the potential for dissolved P loss, shown in the diagram, below.
The Disspolved P Transport Score is determined by adding the factors, as follows.
Note: The Dissolved P Transport Score is a value between 0 and 1, so all raw scores greater than 1 are rounded back to 1.
Dissolved P is lost from fields in runoff. Runoff occurs when soils become saturated with water, so that each additional raindrop and/or contribution from upslope drainage causes water to move over the soil surface. The soil drainage class for each soil type has been defined in the soil survey (and also in the P Index Manual). The linkage between soil drainage and runoff can be seen in the table, below.
| Soil Drainage Description | Infiltration capacity/ permeability |
Runoff potential |
|---|---|---|
| Deep, well-drained sands and gravels | high |
low |
| Moderately drained, moderately fine to moderately coarse texture | moderate |
moderate |
| Impending layer, or moderately fine to fine texture | low |
high |
| Clay soild, soils with high water table | very low |
very high |
The NYS P Index applies higher factors to soils with poorer drainage, as show in the table below.
| Soil Drainage Class | Drainage Factor |
|---|---|
| Well to Excessively well drained | 0.1 |
| Moderately well drained | 0.3 |
| Somewhat poorly drained | 0.7 |
| Poorly to Very Poorly drained | 1.0 |
During flood events, nutrients can be washed away from fields by the expanded stream channel. Flooding frequencies have been defined for each soil type in the soil survey (and also in the P Index Manual). Fields with higher flooding frequencies receive higher factors, as shown in the table, below.
| Flooding Frequency | Flooding Factor |
|---|---|
| Rare to Never ( > 100 years) | 0 |
| Occasional (10 - 100 years) | 0.2 |
| Frequent ( < 10 years) | 1.0 |
This is a measurement of the distance that water flows from the field-edge to the edge of the nearest, receiving watercourse. For practical purposes, the measurement is made on the predominate flow exiting the field. The shorter the distance, the higher the risk. Also, if the flow connects with a perennial stream (i.e. a stream that flows all-year long), the field will have a higher risk than if it connects with an intermittent stream (i.e. a stream that does not flow all-year long).
The steps involved in this assessment are:
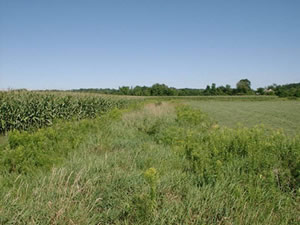
Intermittent Stream (??) in August
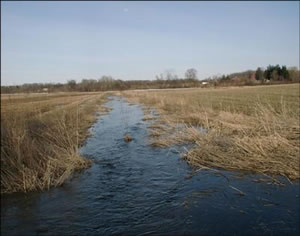
Intermittent Stream (!) in March
Once the stream type is determined and the flow distance is measured, the flow distance factor is calculated by….
Flow Distance to blue line stream as found on topographic map:
|
|
|||||||||||||||||
Now all the factors are complete for the Dissolved P Transport score.