

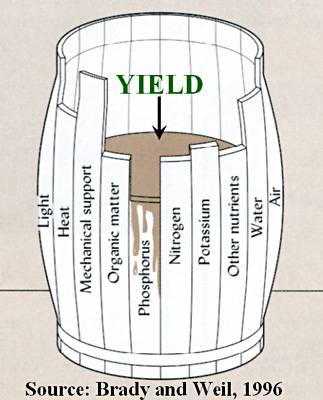
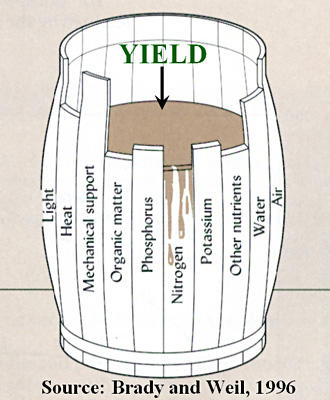
In order to not over- or under-supply crops with nutrients from manure and fertilizer, it's important to determine the crop's need for nutrients. Consider a broader case, including and beyond P for a minute. A crop has many basic needs. The factor that is in shortest supply, relative to crop needs, will limit the yield of the crop, leaving the other factors in excess. This is known as the Limiting Factor Concept.
The Limiting Factor Concept can be illustrated by a barrel of water. The staves represent key factors for crop growth. The shortest stave height limits how much water the barrel can hold (i.e. crop yield).
Soil testing is the basis for determining the adequacy of many of the key factors for crop production. But how can a simple lab analysis of soil nutrients be linked to a fertilizer guideline (i.e. knowing how much fertilizer and manure to apply for efficient crop production)?
A method called the the Sufficiency (or Crop Yield Response) Approach is
used to make the link between a simple 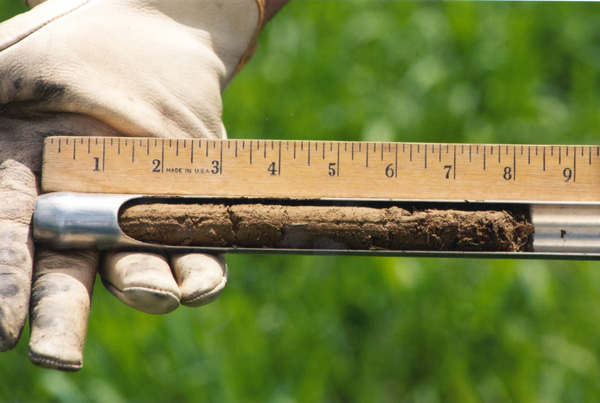 soil nutrient test and the final nutrient
guideline. The approach is based on 1) a standard, quality controlled soil
analysis to measure nutrients extracted in the lab and 2) years of crop yield
studies to link the soil test's extracted nutrient value with the likelihood
of a yield response from the addition of fertilizer. This link between the
laboratory soil test and the likelihood of a crop yield response relies on two
important pieces of information.
soil nutrient test and the final nutrient
guideline. The approach is based on 1) a standard, quality controlled soil
analysis to measure nutrients extracted in the lab and 2) years of crop yield
studies to link the soil test's extracted nutrient value with the likelihood
of a yield response from the addition of fertilizer. This link between the
laboratory soil test and the likelihood of a crop yield response relies on two
important pieces of information.
First, as seen in the chart below, we need to know the critical soil test level, above which a yield response to fertilizer is not likely to occur. The yield response curve illustrates that above a certain soil fertility level, crop yields remain the same even though soil fertility continues to increase.
Secondly, nutrient guidelines for fields testing below the critical soil test value must be determined. To determine crop P guidelines, we hold crop yield trials on a number of fields, across a full range of soil test levels. The treatments on each field are the full range of fertilizer P rates (e.g. 0, 20, 40, 60, and 80 lbs of P205/acre). The results will tell us how many pounds of P fertilizer are needed at a given soil test level to reach the maximum yield (sometimes no fertilizer is needed).
For simplicity, the crop yield response studies allow us to assign relative fertility levels to ranges of actual soil test values (e.g. very low, low, medium/optimum, high, and very high). The relative fertility levels are then linked to crop P guidelines.
Check out the simple example of a crop yield response trial, below.
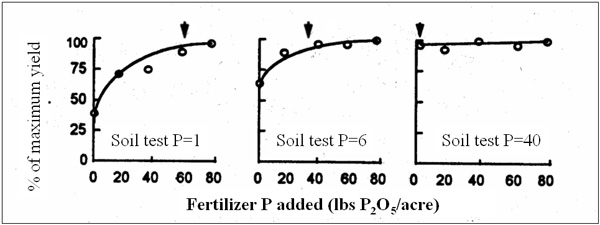
As a note, the crop P guidelines are actually based on the economically optimum yield, meaning the fertilization level that brings the most profit per acre (i.e. the value of extra yield vs. the cost of extra fertilizer) at a given soil test level. For simplicity, we'll work with maximum yield for now.
Click to the next page to learn more about the soil testing portion of the Sufficiency (Yield Response) Approach.